Showing posts with label voodoo. Show all posts

Saturday, 24 November 2012

Am I Attacking Neuroscience?

A New York Times article just out says:
Neuroscience: Under Attack
Under attack by who?

Er... me. And the rest of the usual suspects:
A gaggle of energetic and amusing, mostly anonymous, neuroscience bloggers - including Neurocritic, Neuroskeptic, Neurobonkers and Mind Hacks - now regularly point out the lapses and folly contained in mainstream neuroscientific discourse. 
I had promised not to do any more self-referential posts, but this one wasn't my fault. Just when I thought I was out, they pull me back in.

Anyway, I'm pretty happy with how Neuroskeptic's presented in the article, but not entirely.

The headline is sensationalist - I don't see myself as attacking neuroscience and I don't think any of the others do either. We are trying to defend neuroscience against errors and misrepresentations. My ideal is The Sceptical Chymist, where skepticism helped, rather than undermined, chemistry.

But the job of a headline is to be sensationalist so that's OK. Most of the piece is very good. I'm all on board with this:
Meet the "neuro doubters". The neuro doubter may like neuroscience but does not like what he or she considers its bastardization by glib, sometimes ill-informed, popularizers.
Yet I can't quite go along with this:
A number of the neuro doubters are also humanities scholars who question the way that neuroscience has seeped into their disciplines, creating phenomena like neuro law, which, in part, uses the evidence of damaged brains as the basis for legal defense of people accused of heinous crimes, or neuroaesthetics, a trendy blend of art history and neuroscience.
Admittedly this wasn't directly aimed at me because I'm not a humanities scholar, but I believe that neuroaesthetics and neurolaw are absolutely valid - in theory.

I'm not defending any particular manifestation of those, and I've criticized quite a few. But in the abstract, I see nothing wrong with neuroscience helping to explain those things. It will be difficult in practice, but it's fine to try.

Sunday, 14 October 2012

More on False Positive Neuroimaging

Back in June, I warned that the ever-increasing number of clever methods for analyzing brain imaging data could be a double-edged sword:
Recently, psychologists Joseph Simmons, Leif Nelson and Uri Simonsohn made waves when they published a provocative article called False-Positive Psychology - Undisclosed Flexibility in Data Collection and Analysis Allows Presenting Anything as Significant.
It explained how there are so many possible ways to gather and analyze the results of a  simple psychology experiment that, even if there's nothing interesting really happening, it'll be possible to find some "significant" positive results purely by chance...
The problem's not just seen in psychology however, and I'm concerned that it's especially dangerous in modern neuroimaging research.
In a comment on that post, The Neurocritic pointed out that Michigan PhD student Joshua Carp had put forward the same argument in a conference presentation, several months previously.

Now Carp's published a paper on the topic: On the plurality of (methodological) worlds: estimating the analytic flexibility of fMRI experiments. It's free to access, so check it out.

Whereas I just talked the talk by listing lots of possible ways in which you could analyze a given set of data, Carp walked the walk, and actually did loads of analyses. He took a single dataset, the results of a simple experiment and looked at it in almost 7000 different ways. Each set of results was then thresholded to correct for multiple comparisons in 5 ways, for a grand total of 35,000 outputs.

The variants he considered ranged from how much smoothing to apply, to how to correct for head motion, and many more.

What happened? In a nutshell, the different options made a difference - and the variability was the largest in parts of the brain that were most activated (the "blobs" that lit up). In other words, analytic flexibility makes the most difference in the most interesting places. See the picture at the top.

The location of the maximum peak activation also varied. This is not unexpected, and not, in itself, that worrying - the great majority of the peaks clustered in a few small areas. However, it underlines that different options really can make a difference.

Carp concludes:
Nearly every voxel in the brain showed significant activation under at least one analysis pipeline. In other words, a sufficiently persistent researcher determined to find significant activation in virtually any brain region is quite likely to succeed...

If investigators apply several analysis pipelines to an experiment, and only report the analyses that support their hypotheses, then the prevalence of false positive results in the literature may far exceed the nominal rate. However, analytic flexibility only translates into elevated false positive rates when combined with selective analysis reporting. If researchers reported the results of all analysis pipelines used in their studies, then it would not be problematic.

To the author’s knowledge, there is no evidence that fMRI researchers actually engage in selective analysis reporting. But researchers in other fields do appear to pursue this strategy.
In my experience, fMRI researchers are actually fairly conservative in terms of using different analyses, and certainly I doubt anyone has ever run thousands of them just to get the result they want and I'd estimate that most published findings are not the result of more than a handful of 'attempts' at most.

However it's a serious concern that it could happen, and importantly it's getting ever-easier to do this, with the continuing increase in computer power making running an analysis quicker and cheaper than ever. As to what to do about it, Carp makes several suggestions, and here's one I made earlier...

ResearchBlogging.orgJoshua Carp (2012). On the plurality of (methodological) worlds: estimating the analytic flexibility of fMRI experiments Front. Neurosci. DOI: 10.3389/fnins.2012.00149

Sunday, 2 September 2012

This Is Your Brain On Management

Have you ever wondered whether how the brains of managers work? New research from a group of German neuroscientists and management experts reveals all: Dissociated Neural Processing for Decisions in Managers and Non-Managers

The results were rather remarkable:

Using fMRI, the researchers found that managers' brains were less active in a number of areas, compared to the brains of non-managers, when doing the same task. By contrast, managerial brains were more active than the others only in one small area (caudate nucleus). See above.

So overall, managers had less brain activation during the task. Does that mean they have defective brains? Could this be a neurobiological explanation for the behaviour of Pointy Haired Boss and David Brent?

Not at all, say the authors. The lower activation in the brains of managers means that they were more efficient:
the managers might have found a more efficient way of sorting the presented words. This might have enabled them to faster decide for their preferred category...  Managers as expert decision-makers would seek to find a rule or heuristic on which they could base their decisions. According to previous studies, this phase of rule identification would involve the caudate nucleus
While non-managers wasted brainpower on thinking through the task with several areas of their cerebral cortex, the managers (so to speak) downsized their neurological expenditure by outsourcing the work to their caudate nucleus, an area responsible for applying a simple but effective rule.

One of the problems with these kinds of group-comparison fMRI studies is that under-activation can equally well be glossed as "deficient" or "efficient". Curiously, it usually ends up being whichever fits with the author's narrative.

That's assuming you agree that the task was about "decision making". It consisted of seeing a long series of pairs of words, one "individualistic" such as 'power' and one "collectivistic" such as 'harmony'. Participants just had to pick which word they liked best. There were no right or wrong answers. I'm not sure what kind of manager would have to do anything like that in real life. Maybe a manager of a fridge magnet poetry manufacturer?

That's also assuming the results are solid. The authors provide few details on the fMRI methods (the main results are said to be "cluster-level corrected at p less than 0.0013", which is an unusual threshold to use and an extremely strict one (0.05 cluster-level is more common; this is about 40 times stricter).

Still. If you do buy these results, the message is: management is literally about using as little of your brain as possible...

ResearchBlogging.orgCaspers S, Heim S, Lucas MG, Stephan E, Fischer L, Amunts K, and Zilles K (2012). Dissociated neural processing for decisions in managers and non-managers. PloS one, 7 (8) PMID: 22927984

Saturday, 28 July 2012

Catching Fraud: Simonsohn Says

Everyone's been talking about psychologist Uri Simonsohn and his role in the downfall of two scientific fraudsters.


When the story first broke, the methods Simonsohn used that allowed him to spot the dodgy data were mysterious - which only added to the buzz. The paper revealing the approach is now up online and it's a must-read. It's not often a statistics paper offers the train-wrecky schadenfreude of watching two fraudsters' careers come to a well-deserved end.

What's rather disturbing about the article, however, is that it doesn't really contain much that's new, in principle. Simonsohn used statistics to spot data in published papers that was, in effect, 'too good to be true'. He then followed up seemingly dodgy cases with some more stats, using simulations of what real data ought to look like, to verify that it was in fact made up. A simple idea in retrospect but one that's never been tried before. I don't think there's a single "Simonsohn method", rather, the paper uses multiple techniques, each one tailored to the particular data in question.

But it shouldn't have come to this. Someone else ought to have spotted that the data looked dodgy.

Take this table from one of Simonsohn's conquests, a soon-to-be-retracted paper by Lawrence J Sanna et al:

We now know that the data from Studies 2,3 and 4 were all made up. Each study compared 3 conditions, and what makes these data dodgy is that the standard deviations of the 3 sets of results for each study were almost identical. The chances of that happening are very low and it suggests that someone has (clumsily) made the data up.

I'm going to say that these data are obviously suspicious, at least to anyone who has worked with real data. Maybe you'll say that hindsight is 20/20, but Simonsohn didn't need hindsight and the stats he used were nothing remarkable. I'm not saying that to belittle his achievements, he deserves plenty of credit. But other people deserve blame.

Namely, whoever peer reviewed this paper should have spotted that these data looked unusual - and they should not have needed any special statistical tools to do so.

Simonsohn calls for journals to require that the raw data be made available for all published work, on the grounds that. That's a great idea - and not just because it would help catch bad science: it would facilitate proper research and teaching no end. But Simonsohn didn't need the raw data to detect these cases of fraud - he only checked the raw results to confirm the suspicions based on the published data.

Checking that the data are valid is the job of peer reviewers, and they dropped the ball. Instead Simonsohn had to conduct his own private crusade against fraud... a bit like Batman. Batman is awesome, but the point about Batman is that he's only needed because the police can't or won't cope on their own. He's not a superhero, he's just a guy with the will.

Peer reviewers are the police of science, but all too often, they're asleep on the job. Not just in psychology. Retraction Watch provides plenty of examples of published results in biology that were faked, often in comically crude fashion, and should have been obvious to anyone paying attention.

Peer reviewers are usually anonymous. I wonder if a policy of retrospectively naming and shaming the reviewers when a paper turns out to have been fraudulent, might help motivate them...?

Wednesday, 21 March 2012

Brain Scanning - Just the Tip of the Iceberg?

Neuroimaging studies may be giving us a misleading picture of the brain, according to two big papers just out.


By big, I don't just mean important. Both studies made use of a much larger set of data than is usual in neuroimaging studies. Thyreau et al scanned 1,326 people. For comparison, a lot of fMRI studies have more like n=13. Gonzalez-Castillo et al, on the other hand, only had 3 people - but each one was scanned while performing the same task 500 times over.

Both studies found that pretty much the whole brain "lit up" when people are doing simple tasks. In one case it was seeing videos of people's faces, in the other it was deciding whether stimuli on the screen were letters or numbers.

With all that data, the authors could detect effects too small to be noticed in most fMRI experiments, and it turned out that pretty much everywhere was activated. The signal was stronger in some areas than others, but it wasn't limited to particular "blobs".

So conventional fMRI experiments may just be showing us the tip of the iceberg of brain activity. In a small study, only the strongest activations pass the statistical threshold to show up as blobs, but that doesn't mean the rest of the brain is inactive. It just means it's less active. The idea that only small parts of the brain are 'involved' in any particular task may be a statistical artefact.

In fact, I wonder if the whole idea of treating statistically significant blobs as different from nearly-significant areas is itself a form of the error of interacting effects?

As if that wasn't enough, Gonzalez-Castillo further show that there are lots of activations in the brain - even to very simple stimuli - that might go undetected in conventional studies, because they don't follow the time-course predicted by the usual models.

Have a look -


This shows the average neural activation from various regions of the brain during a letter-number task. The two areas I've highlighted in red are the primary visual cortex, and they do follow the expected 'boxcar' pattern - the brain is active when the stimuli are on the screen, inactive when they're not. But you can see that all kinds of other brain areas are also responding to the stimuli - just in different ways.

For example, the left primary motor cortex was activated during the task. That area controls the right hand, and that makes sense, as people responded by pressing buttons with the right hand. But interestingly, the same area on the other side of the brain was deactivated at exactly the same time, even though people weren't doing anything with their left hand.

These papers illustrate the fact that conventional fMRI is a blunt instrument that often only tells us about the most straightforward events that happen in the brain. A bit like how we only hear the shouts and screams from through our neighbor's walls, not their normal conversations, which aren't loud enough to reach our ears.

That's the bad news, but every blob has a silver lining. fMRI is clearly more powerful than most neuroscientists have realized, and this holds out hope for cracking some of the trickiest questions. As Gonzalez-Castillo et al put it
This result helps narrow the gap between thousands of fMRI manuscripts showing limited activation in response to tasks and cognition theories that defend that cognition—understood as the process of “configuring the way in which sensory information becomes linked to adaptive responses and meaningful experiences”—can only result from the distributed collaboration of primary sensory, upstream and downstream unimodal, heteromodal, paralimbic, and limbic regions... [we were able to] switch from a regime where activity detection relates primary to sensory processing to a more sensitive regime, where activity detection includes also cognitive processes with subtler BOLD signatures.
Link: See also the interesting discussion here: Surely, God loves the .06 (blob) nearly as much as the .05.


ResearchBlogging.orgThyreau, B., Schwartz, Y., Thirion, B., Frouin, V., Loth, E., Vollstädt-Klein, S., Paus, T., Artiges, E., Conrod, P., Schumann, G., Whelan, R., and Poline, J. (2012). Very large fMRI study using the IMAGEN database: Sensitivity–specificity and population effect modeling in relation to the underlying anatomy NeuroImage DOI: 10.1016/j.neuroimage.2012.02.083

Gonzalez-Castillo, J., Saad, Z., Handwerker, D., Inati, S., Brenowitz, N., and Bandettini, P. (2012). Whole-brain, time-locked activation with simple tasks revealed using massive averaging and model-free analysis Proceedings of the National Academy of Sciences DOI: 10.1073/pnas.1121049109

Tuesday, 31 January 2012

Voodoo Neuroscience Revisited

Two years ago, neuroscientists were shaken by the appearance of a draft paper showing that half of the published work in a particular field had fallen prey to a major statistical error.


Originally called "Voodoo Correlations in Social Neuroscience", it ended up with the less snappy name of Puzzlingly high correlations in fMRI studies of emotion, personality, and social cognition. I prefer the old title.

The error in question is now known variously as the "circular analysis problem", "non-independence problem" or "double-dipping" although I still call it the "voodoo problem". In a nutshell it arises whenever you take a large set of data, search for data points which are statistically significantly different from some baseline (null hypothesis), and then go on to perform further statistics only on those significant data points.

The problem is that when you picked out the statistically significant observations, you selected the data points that were especially "good", so if you then do some more analyses only on those data, you are almost guaranteed to find something "good". To avoid this you need to make sure that your second analysis is truly independent of your first one.

Anyway, Vul and Pashler, the main authors of the original voodoo article, have just written a short piece in NeuroImage offering some reflections on the paper and the aftermath. They don't make any major new arguments but it's a good read. Particularly fun is their explanation of what inspired them to look into the voodoo problem:
In early 2005 a speaker in our department reported that BOLD activity in a small region of the brain can account for the great majority of the variance in speed with which subjects walk out of the experiment several hours later (this finding was never published as far as we know). The implications of this result struck us as puzzling, to say the least: Are walking speeds really so reliable that most of their variability can be predicted? Does a focal cortical region determine walking speeds? Are walking speeds largely predetermined hours in advance? These implications all struck us as far-fetched...
But they reveal that it was one paper in particular that set them off voodoo-hunting
Our interest in probing the matter was further whetted by an episode occurring a short while later: Grill-Spector et al. (2006) reported that individual voxels in face selective regions have a variety of stable stimulus preferences; in a critical commentary, Baker et al. (2007) found that the analysis used to ascertain this fact implicitly built these conclusions into the method, such that the same analysis applied to noise data (voxels from the nasal cavity) revealed a similar variety of stable preferences. It occurred to us that a similar circularity might underlie the puzzlingly high correlations.

To their credit, Grill-Spector et al quickly accepted Baker et al's criticism and admitted that some of their original conclusions had been wrong.

ResearchBlogging.orgVul, E., and Pashler, H. (2012). Voodoo and circularity errors NeuroImage DOI: 10.1016/j.neuroimage.2012.01.027

Saturday, 26 November 2011

Beware Dead Fish Statistics

An editorial in the Journal of Physiology offers some important notes on statistics.


But even more importantly, it refers to a certain blog in the process:
The Student’s t-test merely quantifies the ‘Lack of support’ for no effect. It is left to the user of the test to decide how convincing this lack might be. A further difficulty is evident in the repeated samples we show in Figure 2: one of those samples was quite improbable because the P-value was 0.03, which suggests a substantial lack of support, but that’s chance for you! A parody of this effect of multiple sampling, taken to extremes, can be found at http://neuroskeptic.blogspot.com/2009/09/fmri-gets-slap-in-face-with-dead-fish.html
This makes it the second academic paper to refer to this blog as far. Although I feel rather bad about this one, since the citation ought to have been to the original dead salmon brain scanning study by Craig Bennett. I just wrote about it.

Actually, though, this editorial was published in five separate journals: The Journal of Physiology, Experimental Physiology, the British Journal of Pharmacology, Advances in Physiology Education, Microcirculation, and Clinical and Experimental Pharmacology and Physiology. Phew.

In fact, you could say that this makes not two but six citations for Neuroskeptic now. Yes. Let's go with that.

Anyway, after discussing the history of the ubiquitous Student's t-test - which was invented in a brewery - it reminds us that the p value you get from such a t-test doesn't tell you how likely it is that your results are "real".

Rather, it tells you how often you'd get the result you did, if there was no effect and it was just random chance. That's a big difference. A p value of 0.01 doesn't mean your results are 99% likely to be real. It means that there's a 1% chance that you'd get them, by chance. But if you did say 100 experiments, or more likely, 100 statistical tests on the same data, then you'd expect to get at least one result with a p value of 0.01 purely by chance.

In that case it would be silly to think that the finding was only 1% likely to be a fluke. Of course it could be true. But we'd have no particular reason to think so until we get some more data.

This is what the dead salmon study was all about. This multiple comparisons issue is very old, but very important. Arguably the biggest problem in science today is that we're doing too many comparisons and only reporting the significant ones.

ResearchBlogging.orgDrummond GB, & Tom BD (2011). Statistics, probability, significance, likelihood: words mean what we define them to mean. British journal of pharmacology, 164 (6), 1573-6 PMID: 22022804

Friday, 25 February 2011

The Decline And Fall of Effects In Science

Nature has a piece called Unpublished results hide the decline effect.
This refers to the fact that many scientific findings which seem to indicate something big is happening, end up getting smaller and smaller as more people try to replicate them until they, eventually, may vanish entirely.

The Last Psychiatrist's take is that "The Decline Effect" just represents sloppy thinking, treating different things as if they were all instances of The One True Phenomenon. Someone does a study about something and finds an effect. Then someone else comes along and does a new study, of a related but different topic, and finds a different result. Both are right: there's a difference. Only if you, sloppily, decide that both studies were measuring the same thing does the "Decline Effect" appear.

This is perfectly true and I've touched on it before, but I think it's a bit optimistic. It assumes that the first study was true. Sometimes they are. But because of the way science is published at the moment, a lot of results that get published are flukes. Some even say that the majority are.

The problem is that there are so many ways to statistically analyze any given body of data that it's easy to test and retest it until you find a "positive result" - and then publish that, without saying (or only saying in the small print) that your original tests all came out negative. Combine this with selective publication of only the best data, and other scientific sins, and you can pull positive results out the hat of mere random noise.

In the Nature article, Jonathan Schooler discusses this and suggests that an open-access repository of findings (meaning raw data rather than the end product of analyses) would be A Good Thing. I agree. However, he seems to think that if we did this, we might still observe the "Decline Effect", and would be able to find out more about it. He even seems to suggest that some kind of weird quantum effect might mean that scientists are actually changing the laws of reality by observing them
Perhaps, just as the act of observation has been suggested to affect quantum measurements, scientific observation could subtly change some scientific effects. Although the laws of reality are usually understood to be immutable, some physicists, including Paul Davies, director of the BEYOND: Center for Fundamental Concepts in Science at Arizona State University in Tempe, have observed that this should be considered an assumption, not a foregone conclusion.
Hmm. Maybe. But there is really no need to posit such magical mysteries when plain old statistical conjuring tricks seem like a perfectly good explanation. On my view a raw result repository would not explain the decline effect, but just make it disappear.

Schooler doesn't go into detail as to how this repository would be set up, but he does cite the fact that we already have a pretty good one for clinical trials of medicines conducted in the USA. Anyone running a clinical trial is required to register it in advance, saying what they're planning to do and crucially, to spell out which statistics they are going to run on the data when it arrives.

What's really silly is that most scientists already do this when applying for funding: most grant applications include detailed statistical protocols. The problem is that these are not made public so people can ignore them when it comes to publication. Back in 2008 I suggested that scientific journals should require all studies, not just clinical trials, to be publicly pre-registered if they're to be considered for publication. This would be eminently do-able if there was a will to make it happen.

ResearchBlogging.orgSchooler, J. (2011). Unpublished results hide the decline effect Nature, 470 (7335), 437-437 DOI: 10.1038/470437a

Friday, 25 June 2010

The A Team Sets fMRI to Rights

Remember the voodoo correlations and double-dipping controversies that rocked the world of fMRI last year? Well, the guys responsible have teamed up and written a new paper together. They are...

The paper is Everything you never wanted to know about circular analysis, but were afraid to ask. Our all-star team of voodoo-hunters - including Ed "Hannibal" Vul (now styled Professor Vul), Nikolaus "Howling Mad" Kriegeskorte, and Russell "B. A." Poldrack - provide a good overview of the various issues and offer their opinions on how the field should move forward.

The fuss concerns a statistical trap that it's easy for neuroimaging researchers, and certain other scientists, to fall into. Suppose you have a large set of data - like a scan of the brain, which is a set of perhaps 40,000 little cubes called voxels - and you search it for data points where there is a statistically significant effect of some kind.

Because you're searching in so many places, in order to avoid getting lots of false positives you set the threshold for significance very high. That's fine in itself, but a problem arises if you find some significant effects and then take those significant data points and use them as a measure of the size of the effects - because you have specifically selected your data points on the basis that they show the very biggest effects out of all your data. This is called the non-independence error and it can make small effects seem much bigger.

The latest paper offers little that's new in terms of theory, but it's a good read and it's interesting to get the authors' expert opinion on some hot topics. Here's what they have to say about the question of whether it's acceptable to present results that suffer from the non-independence error just to "illustrate" your statistically valid findings:
Q: Are visualizations of non-independent data helpful to illustrate the claims of a paper?

A: Although helpful for exploration and story telling, circular data plots are misleading when presented as though they constitute empirical evidence unaffected by selection. Disclaimers and graphical indications of circularity should accompany such visualizations.
Now an awful lot of people - and I confess that I've been among them - do this without the appropriate disclaimers. Indeed, it is routine. Why? Because it can be useful illustration - although the size of the effects appears to be inflated in such graphs, on a qualitative level they provide a useful impression of the direction and nature of the effects.

But the A Team are right. Such figures are misleading - they mislead about the size of the effect, even if only inadvertently. We should use disclaimers, or ideally, avoid using misleading graphs. Of course, this is a self-appointed committee: no-one has to listen to them. We really should though, because what they're saying is common sense once you understand the issues.

It's really not that scary - as I said on this blog at the outset, this is not going to bring the whole of fMRI crashing down and end everyone's careers; it's a technical issue, but it is a serious one, and we have no excuse for not dealing with it.

ResearchBlogging.orgKriegeskorte, N., Lindquist, M., Nichols, T., Poldrack, R., & Vul, E. (2010). Everything you never wanted to know about circular analysis, but were afraid to ask Journal of Cerebral Blood Flow & Metabolism DOI: 10.1038/jcbfm.2010.86

Friday, 30 April 2010

New, Voodoo-Free fMRI Technique

MIT brain scanners Fedorenko et al present A new method for fMRI investigations of language: Defining ROIs functionally in individual subjects. Also on the list of authors is Nancy Kanwisher, one of the feared fMRI voodoo correlations posse.

The paper describes a technique for mapping out the "language areas" of the brain in individual people, not for their own sake, but as a way of improving other fMRI studies of language. That's important because while everyone's brain is organized roughly the same way, there are always individual differences in the shape, size and location of the different regions.

This is a problem for fMRI researchers. Suppose you scan 10 people and show them pictures of apples and pictures of pears. And suppose that apples activate the brain's Fruit Cortex much more strongly than pears. But unfortunately, the Fruit Cortex is a small area, and its location varies between people. In fact, in your 10 subjects, no-one's Fruit Cortex overlaps with anyone else's, even though everyone has one and they all work exactly the same way.

If you did this experiment you'd fail to find the effect of apples vs. pears, even though it's a strong effect, because there will be no one place in the brain where apples reliably cause more activation. What you need is a way of finding the Fruit Cortex in each person beforehand. What you'd need to do is a functional localization scan - say, showing people a big bowl of fruit - as a preliminary step.

Fedorenko et al scanned a bunch of people while doing a simple reading task, and compared that to a control condition, reading a random list of nonsense which makes no linguistic sense. As you can see, there's a lot of variation between people, but there's also clearly a basic pattern of activation: it looks a bit like a tilted "V" on the left side of the brain:

These are the language areas of each person. (Incidentally, this is why fMRI, despite its limitations, is an amazing technology. There is no better way of measuring this activation. EEG is cheaper but nowhere near as good at localizing activity; PET is close, but it's slow, expensive and involves injecting people with radioactivity.)

Fedorenko et al then overlapped all the individual images to produce of map of the brain showing how many people got activation in each part:

The most robust activations were on the left side of the brain, and they formed a nice "V" shape again. These are the areas which have long been known to be involved in language, so this is not surprising in itself.

Here's the clever bit: they then took the areas activated in a large % of people, and automatically divided them up into sub-regions; each of the "peaks" where an especially large proportion of subjects showed activation became a separate region.

This is on the assumption that these peaks represent parts of the brain with distinct functions - separate "language modules" as it were. But each module will be in a slightly different place in each person (see the first picture). So they overlapped the subdivisions with the individual activation blobs to get a set of individual functional zones they call Group-constrained Subject-Specific functional Regions of Interest, or GcSSfROIs to their friends.

Fedorenko et al claim various advantages to this technique, and present data showing that it produces nice results in independent subjects (i.e. not the ones they used to make the group map in the first place.)

In particular, they argue that it should allow future fMRI studies to have a better chance of finding the specific functions of each region. So far, experiments using fMRI to investigate language have largely failed to find activations specific to particular aspects of language like grammar, word meaning, etc. which is unexpected because patients suffering lesions to specific areas often do show very selective language problems.

Does this relate to the voodoo correlations issue? Indirectly, yes. The voodoo (non-independence error) problem arises when you do a large number of comparisons, and then focus on the "best" results, because these are likely to be wholly, or partially, only that good by chance.

Fedorenko et al's method allows you to avoid doing lots of comparisons in the first place. Instead of looking all over the whole brain for something interesting, you can first do a preliminary scan to map out where in each person's brain interesting stuff is likely to happen, and then focus on those bits in the real experiment.

There's still a multiple-comparisons problem: Fedorenko et al identified 16 candidate language areas per brain, and future studies could well provide more. But that's nothing compared to the 40,000 voxels in a typical whole-brain analysis. We'll have to wait and see if this technique proves useful in the real world, but it's an interesting idea...

ResearchBlogging.orgFedorenko, E., Hsieh, P., Nieto Castanon, A., Whitfield-Gabrieli, S., & Kanwisher, N. (2010). A new method for fMRI investigations of language: Defining ROIs functionally in individual subjects Journal of Neurophysiology DOI: 10.1152/jn.00032.2010

Wednesday, 10 March 2010

Can We Rely on fMRI?

Craig Bennett (of Prefrontal.org) and Michael Miller, of dead fish brain scan fame, have a new paper out: How reliable are the results from functional magnetic resonance imaging?


Tal over at the [citation needed] blog has an excellent in-depth discussion of the paper, and Mind Hacks has a good summary, but here's my take on what it all means in practical terms.

Suppose you scan someone's brain while they're looking at a picture of a cat. You find that certain parts of their brain are activated to a certain degree by looking at the cat, compared to when they're just lying there with no picture. You happily publish your results as showing The Neural Correlates of Cat Perception.

If you then scanned that person again while they were looking at the same cat, you'd presumably hope that exact same parts of the brain would light up to the same degree as they did the first time. After all, you claim to have found The Neural Correlates of Cat Perception, not just any old random junk.

If you did find a perfect overlap in the area and the degree of activation that would be an example of 100% test-retest reliability. In their paper, Bennett and Miller review the evidence on the test-retest reliability of fMRI studies. They found 63 of them. On average, they found that the reliability of fMRI falls quite far short of perfection: the areas activated (clusters) had a mean Dice overlap of 0.476, while the strength of activation was correlated with a mean ICC of 0.50.

But those numbers, taken out of context, do not mean very much. Indeed, what is a Dice overlap? You'll have to read the whole paper to find out, but even when you do, they still don't mean that much. I suspect this is why Bennett and Miller don't mention them in the Abstract of the paper, and in fact they don't spend more than a few lines discussing them at all.

A Dice overlap of 0.476 and an ICC of 0.50 are what you get if average over all of the studies that anyone's done looking at the test-retest reliability of any particular fMRI experiment. But different fMRI experiments have different reliabilities. Saying that the average reliability of fMRI is 0.5 is rather like saying that the mean velocity of a human being is 0.3 km per hour. That's probably about right, averaging over everyone in the world, including those who are asleep in bed and those who are flying on airplanes - but it's not very useful. Some people are moving faster than others, and some scans are more reliable than others.


Most of this paper is not concerned with "how reliable fMRI is", but rather, with how to make any given scanning experiment more reliable. And this is an important thing to write about, because even the most optimistic cognitive neuroscientist would agree that many fMRI results are not especially reliable, and as Bennett and Miller say, reliability matters for lots of reasons:
Scientific truth. While it is a simple statement that can be taken straight out of an undergraduate research methods course, an important point must be made about reliability in research studies: it is the foundation on which scientific knowledge is based. Without reliable, reproducible results no study can effectively contribute to scientific knowledge.... if a researcher obtains a different set of results today than they did yesterday, what has really been discovered?
Clinical and Diagnostic Applications. The longitudinal assessment of changes in regional brain activity is becoming increasingly important for the diagnosis and treatment of clinical disorders...
Evidentiary Applications. The results from functional imaging are increasingly being submitted as evidence into the United States legal system...
Scientific Collaboration. A final pragmatic dimension of fMRI reliability is the ability to share data between researchers...
So what determines the reliability of any given fMRI study? Lots of things. Some of them are inherent to the nature of the brain, and are not really things we can change: activation in response to basic perceptual and motor tasks is probably always going to be more reliable than activation related to "higher" functions like emotions.

But there are lots of things we can change. Although it's rarely obvious from the final results, researchers make dozens of choices when designing and analyzing an fMRI experiment, many of which can at least potentially have a big impact on the reliability of their findings. Bennett and Miller cover lots of them:
voxel size... repetition time (TR), echo time (TE), bandwidth, slice gap, and k-space trajectory... spatial realignment of the EPI data can have a dramatic effect on lowering movement-related variance ... Recent algorithms can also help remove remaining signal variability due to magnetic susceptibility induced by movement... simply increasing the number of fMRI runs improved the reliability of their results from ICC = 0.26 to ICC = 0.58. That is quite a large jump for an additional ten or fifteen minutes of scanning...
The details get extremely technical, but then, when you do an fMRI scan you're using a superconducting magnet to image human neural activity by measuring the quantum spin properties of protons. It doesn't get much more technical.

Perhaps the central problem with modern neuroimaging research is that it's all too easy for researchers to write off the important experimental design issues as "merely" technicalities, and just put some people in a scanner using the default scan sequence and see what happens. This is something few fMRI users are entirely innocent of, and I'm certainly not, but it is a serious problem. As Bennett and Miller point out, the devil is in the technical details.
The generation of highly reliable results requires that sources of error be minimized across a wide array of factors. An issue within any single factor can significantly reduce reliability. Problems with the scanner, a poorly designed task, or an improper analysis method could each be extremely detrimental. Conversely, elimination of all such issues is necessary for high reliability. A well maintained scanner, well designed tasks, and effective analysis techniques are all prerequisites for reliable results.
ResearchBlogging.orgBennett CM, Miller MB. (2010). How reliable are the results from functional magnetic resonance imaging? Annals of the New York Academy of Sciences

Wednesday, 16 September 2009

fMRI Gets Slap in the Face with a Dead Fish

A reader drew my attention to this gem from Craig Bennett, who blogs at prefrontal.org:

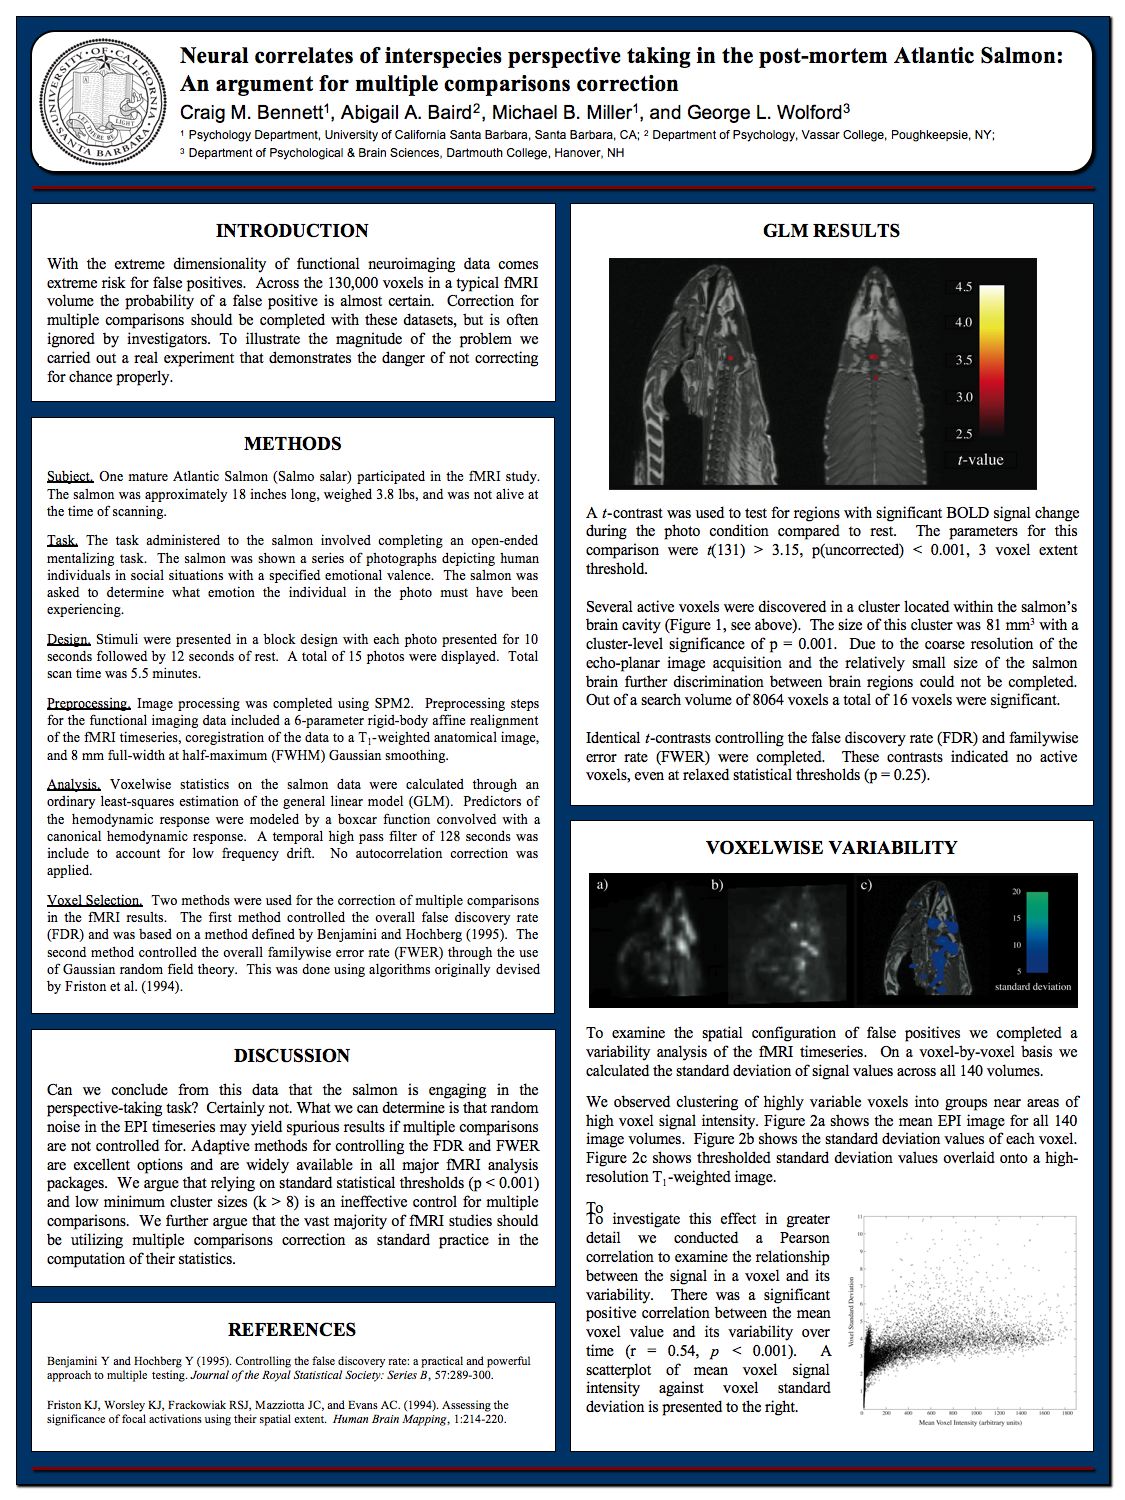
Neural correlates of interspecies perspective taking in the post-mortem Atlantic Salmon: An argument for multiple comparisons correction

This is a poster presented by Bennett and colleagues at this year's Human Brain Mapping conference. It's about fMRI scanning on a dead fish, specifically a salmon. They put the salmon in an MRI scanner and "the salmon was shown a series of photographs depicting human individuals in social situations. The salmon was asked to determine what emotion the individual in the photo must have been experiencing."

I'd say that this research was justified on comedic grounds alone, but they were also making an important scientific point. The (fish-)bone of contention here is multiple comparisons correction. The "multiple comparisons problem" is simply the fact that if you do a lot of different statistical tests, some of them will, just by chance, give interesting results.

In fMRI, the problem is particularly severe. An MRI scan divides the brain up into cubic units called voxels. There are over 40,000 in a typical scan. Most fMRI analysis treats every voxel independently, and tests to see if each voxel is "activated" by a certain stimulus or task. So that's at least 40,000 separate comparisons going on - potentially many more, depending upon the details of the experiment.

Luckily, during the 1990s, fMRI pioneers developed techniques for dealing with the problem: multiple comparisons correction. The most popular method uses Gaussian Random Field Theory to calculate the probability of falsely "finding" activated areas just by chance, and to keep this acceptably low (details), although there are other alternatives.

But not everyone uses multiple comparisons correction. This is where the fish comes in - Bennett et al show that if you don't use it, you can find "neural activation" even in the tiny brain of dead fish. Of course, with the appropriate correction, you don't. There's nothing original about this, except the colourful nature of the example - but many fMRI publications still report "uncorrected" results (here's just the last one I read).

Bennett concludes that "the vast majority of fMRI studies should be utilizing multiple comparisons correction as standard practice". But he says on his blog that he's encountered some difficulty getting the results published as a paper, because not everyone agrees. Some say that multiple comparisons correction is too conservative, and could lead to genuine activations being overlooked - throwing the baby salmon out with the bathwater, as it were. This is a legitimate point, but as Bennett says, in this case we should report both corrected and uncorrected results, to make it clear to the readers what is going on.

Monday, 27 April 2009

More Brain Voodoo, and This Time, It's Not Just fMRI

Ed Vul et al recently created a splash with their paper, Puzzlingly high correlations in fMRI studies of emotion, personality and social cognition (better known by its previous title, Voodoo Correlations in Social Neuroscience.) Vul et al accused a large proportion of the published studies in a certain field of neuroimaging of committing a statistical mistake. The problem, which they call the "non-independence error", may well have made the results of these experiments seem much more impressive than they should have been. Although there was no suggestion that the error was anything other than an honest mistake, the accusations still sparked a heated and ongoing debate. I did my best to explain the issue in layman's terms in a previous post.

Now, like the aftershock following an earthquake, a second paper has appeared, from a different set of authors, making essentially the same accusations. But this time, they've cast their net even more widely. Vul et al focused on only a small sub-set of experiments using fMRI to examine correlations between brain activity and personality traits. But they implied that the problem went far beyond this niche field. The new paper extends the argument to encompass papers from across much of modern neuroscience.

The article, Circular analysis in systems neuroscience: the dangers of double dipping, appears in the extremely prestigious Nature Neuroscience journal. The lead author, Dr. Nikolaus Kriegeskorte, is a postdoc in the Section on Functional Imaging Methods at the National Institutes of Health (NIH).

Kriegeskorte et al's essential point is the same as Vul et al's. They call the error in question "circular analysis" or "double-dipping", but it is the same thing as Vul et al's "non-independent analysis". As they put it, the error could occur whenever
data are first analyzed to select a subset and then the subset is reanalyzed to obtain the results.
and it will be a problem whenever the selection criteria in the first step are not independent of the reanalysis criteria in the second step. If the two s
ets of criteria are independent, there is no problem.


Suppose that I have some eggs. I want to know whether any of the eggs are rotten. So I put all the eggs in some water, because I know that rotten eggs float. Some of the eggs do float, so I suspect that they're rotten. But then I decide that I also want to know the average weight of my eggs . So I take a handful of eggs within easy reach - the ones that happen to be floating - and weigh them.

Obviously, I've made a mistake. I've selected the eggs that weigh the least (the rotten ones) and then weighed them. They're not representative of all my eggs. Obviously, they will be lighter than the average. Obviously. But in the case of neuroscience data analysis, the same mistake may be much less obvious. And the worst thing about the error is that it makes data look better, i.e. more worth publishing:
Distortions arising from selection tend to make results look more consistent with the selection criteria, which often reflect the hypothesis being tested. Circularity is therefore the error that beautifies results, rendering them more attractive to authors, reviewers and editors, and thus more competitive for publication. These implicit incentives may create a preference for circular practices so long as the community condones them.
To try to establish how prevalent the error is, Kriegeskorte et al reviewed all of the 134 fMRI papers published in the highly regarded journals Science, Nature, Nature Neuroscience, Neuron and the Journal of Neuroscience during 2008. Of these, they say, 42% contained at least one non-independent analysis, and another 14% may have done. That leaves 44% which were definitely "clean". Unfortunately, unlike Vul et al who did a similar review, they don't list the "good" and the "bad" papers.

They then go on to present the results of two simulated fMRI experiments in which seemingly exciting results emerge out of pure random noise, all because of the non-independence error. (One of these simulations concerns the use of pattern-classification algorithms to "read minds" from neural activity, a technique which I previously discussed). As they go on to point out, these are extreme cases - in real life situations, the error might only have a small impact. But the point, and it's an extremely important one, is that the error can creep in without being detected if you're not very careful. In both of their examples, the non-independence error is quite subtle and at first glance the methodology is fine. It's only on closer examination that the problem becomes apparent. The price of freedom from the error is eternal vigilance.

But it would be wrong to think that this is a problem with fMRI alone, or even neuroimaging alone. Any neuroscience experiment in which a large amount of data is collected and only some of it makes it into the final analysis is equally at risk. For example, many neuroscientists use electrodes to record the electrical activity in the brain. It's increasingly common to use not just one electrode but a whole array of them to record activity from more than brain one cell at once. This is a very powerful technique, but it raises the risk the non-independence error, because there is a temptation to only analyze the data from those electrodes where there is the "right signal", as the author's point out:
In single-cell recording, for example, it is common to select neurons according to some criterion (for example, visual responsiveness or selectivity) before applying
further analyses to the selected subset. If the selection is based on the same dataset as is used for selective analysis, biases will arise for any statistic not inherently independent of the selection criterion.
In fact,
Kriegeskorte et al praise fMRI for being, in some ways, rather good at avoiding the problem:
To its great credit, neuroimaging has developed rigorous methods for statistical mapping from its beginning. Note that mapping the whole measurement volume avoids selection altogether; we can analyze and report results for all locations equally, while accounting for the multiple tests performed across locations..
With any luck, the publication of this paper and Vul's so close together will force the neuroscience community to seriously confront this error and related statistical weaknesses in modern neuroscience data analysis. Neuroscience can only emerge stronger from the debate.

ResearchBlogging.orgKriegeskorte, N., Simmons, W., Bellgowan, P., & Baker, C. (2009). Circular analysis in systems neuroscience: the dangers of double dipping Nature Neuroscience DOI: 10.1038/nn.2303